My Courses
 My Portfolio
 Refer & Earn
 My Purchases
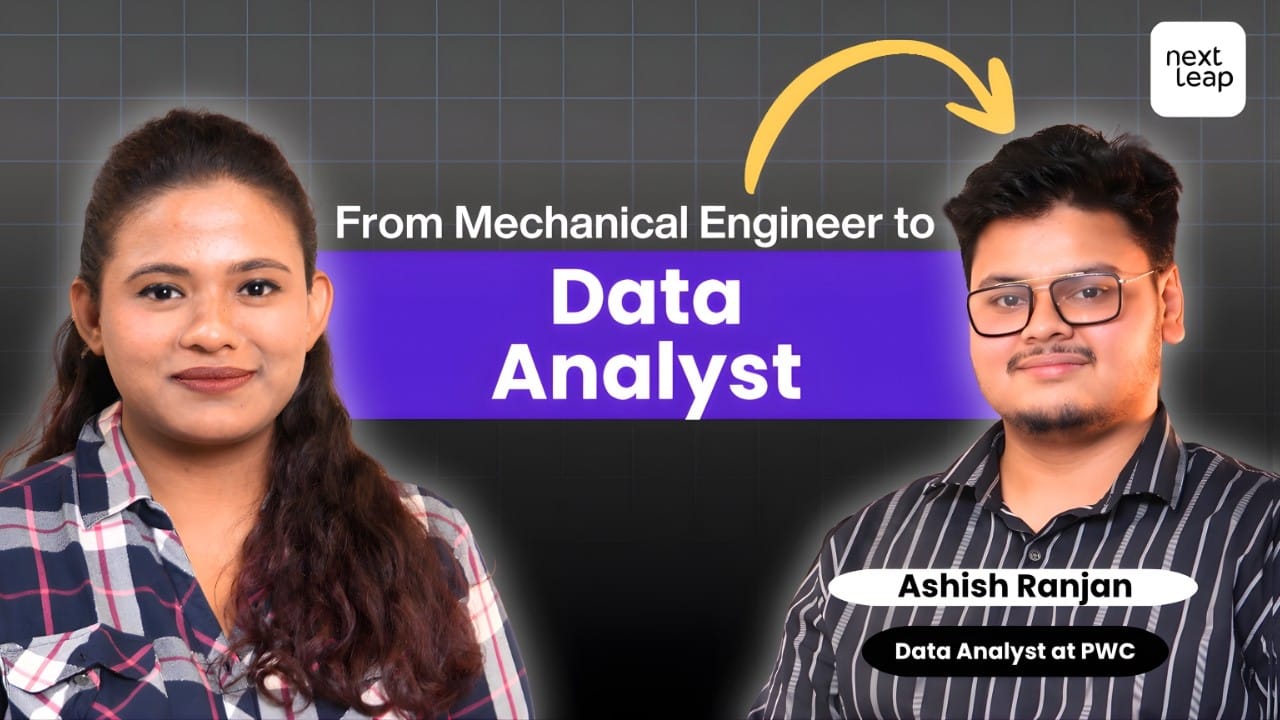
At a glance
- Before: Mechanical engineering student who also studied physics
- Now: Data Analyst at PwC, in the last semester of his B.Tech
- Program: NextLeap Data Analyst Fellowship, Top Fellow
- What made the difference: Structured learning and an industry-level final project
- Biggest lesson: "Work on a real life project. Not only learning skills can help you."
Ashish's mechanical engineer to data analyst switch did not happen in a day. He was in the last semester of his B.Tech in mechanical engineering when he began working as a data analyst at PwC. On the NextLeap Alumni Podcast he explained how his interest built up, why structured learning mattered, what his top-fellow project involved and what real-world data actually looks like.
How did a mechanical engineer to data analyst switch happen?
Through a collection of events, not a sudden change. Ashish says that in mechanical engineering he handled data every day, predicting results from experiments and from simple things like gear ratios. That gave him an interest in data. When an opportunity came and he heard about NextLeap, he moved into data analytics.
He also has a degree in physics alongside mechanical, and says physics experiments taught him to note down data that changes every second. From there he developed the knowledge of understanding data, which he calls the most important thing in data analytics: once you understand the data, you can work with it easily.
Is it hard to get into data without a data degree?
It is very difficult for someone who is not an engineer, Ashish says, but engineers are trained to learn and to solve problems. It does not matter whether you are a chemical or mechanical engineer; you are trained to do whatever is given to you. If a new language such as SQL or Python comes, and you create the interest, you can learn anything. That, he says, is the attitude of an engineer, and it helped him grow in this role.
How did NextLeap help him?
With structure. Ashish points out that all the videos and skills are available free on YouTube, but the differentiating factor NextLeap provides is structured learning. If you learn in a structured way, your fundamentals are clear, and then you can learn anything.
Before, when he learned on his own, he went from Python into machine learning and then into visualisation, using Power BI at the same time, and it left him very confused. With NextLeap everything was structured, and that helped him a lot.
What did he do to become a top fellow?
A major industry-level project. Ashish says tools such as SQL, Excel and Power BI are common, but learning tools does not land you a job. Projects and real-world experience do. To become a top fellow, his cohort did a major project that he calls top-notch and industry level. His team scored more than 70%, and it is a critical part of his resume for any interview.
What was the project about?
Bike bookings. The data came from a company where customers booked bikes from one station to another, in three categories: hybrid, electric and petrol. The team started with the raw data, looked at how the tables were formed, then cleaned it by removing duplicates, empty spaces and nulls, and fixing strings in integer fields.
They visualised the cleaned data and then did exploratory data analysis, defining hypotheses. One hypothesis was that customers use electric vehicles more on Sundays and weekends. The data showed that they use electric vehicles more than petrol or hybrid on weekends, and the team could also see why. They tested about five hypotheses and used Tableau to build bar graphs showing whether each was right.
The main thing, he says, is that data analysis is not only about writing code. You have to explain what the data is saying to clients, customers or senior managers, who may not understand the data. The thinking you present is part of the job, not only the tool.
Which skills does a fresher need?
Four core skills, in Ashish's view. Start with SQL, the very basic of data analytics. Then cleaning and structuring needs Python, with its NumPy and pandas libraries. Add Power BI or Tableau for visualisation. He calls PySpark good to have, since the world is moving into big data.
How is real-world data different from what freshers imagine?
It is a total mess. Ashish says a field for date of birth may contain a name. In any data analyst job, he says, about 70% of your time goes into cleaning and understanding the data. Freshers think they will master SQL and the tools, but forget about the data itself. Understanding the data is the most important part, and real data can be anything.
What was the hardest part of switching?
Coding. Ashish was a full-fledged mechanical engineer designing gears in SolidWorks and Fusion 360 and running finite element analysis. When he switched, Python was the most challenging thing. SQL is not as hard as people make it, he says, but with Python you have to know the logic and how the code works.
What are recruiters looking for in freshers?
Business-side thinking. Ashish says Python and SQL are important, but recruiters and interviewers are now not only looking at how much you know the tools. They want to see how you represent yourself and your data, because customers and higher management may not know SQL or Python but need to know what the data is about. You have to put the data in very simple language.
What is a three-month roadmap for a data analyst?
Excel first, then SQL, then visualisation, then Python. Ashish says Excel is easy and can be finished in three to four days. Then learn SQL, which he calls one of the most important things in data analytics. After that, learn Power BI or Tableau, and finally Python, especially NumPy and pandas. If you can, add PySpark.
Are data analyst and data scientist the same job?
It depends on where you work. According to Ashish, in India they are two different roles, but at some bigger companies outside, one data analyst role covers both. You clean and visualise data and also run models to predict what happens next. Either way, he says, you have to present the data and stay business-aware.
What is his advice for freshers?
Build a real-life project. Ashish puts it plainly:
Work on a real life project. Not only learning skills can help you.
He says it helps in any interview, technical or case-based, because you can steer the conversation while explaining a good project. While learning new skills, projects help most of the time.
Watch the full conversation
Ashish shared his story on the NextLeap Alumni Podcast.
Start your own switch
Ashish's route came from structured learning and a real project he could talk about in interviews. If you want to become a data analyst, the NextLeap Data Analyst Fellowship offers mentors, industry-style projects and interview preparation.
Frequently asked questions
Can a mechanical engineer become a data analyst?
Ashish did. He was in the last semester of his mechanical engineering B.Tech when he started working as a data analyst at PwC. He says engineers are trained to learn and solve problems, so a new language like SQL or Python is learnable if you create the interest.
What skills does a fresher need to become a data analyst?
Ashish names SQL first, then Python for cleaning and structuring with NumPy and pandas, and Power BI or Tableau for visualisation. PySpark is good to have for big data. He adds that recruiters now also look for business thinking and the ability to explain data in simple language.
How is real-world data different from what freshers imagine?
Ashish says real-world data is a total mess. A date of birth field can contain a name. In any data analyst job, he says, about 70% of your time goes into cleaning and understanding the data, so understanding the data itself is more important than mastering tools.
What is a three-month roadmap to become a data analyst?
Ashish suggests starting with Excel, which takes three to four days, then SQL, then Power BI or Tableau, and finally Python, especially NumPy and pandas. PySpark is optional for big data. He also says to build a real project along the way, because it helps in interviews.